
January 2025
Our signal color this month is staying at a yellow as current market stability may be disrupted by potential catalysts on the horizon, including changes from the incoming administration and the possibility of another strike at the East and Gulf Coast ports.
Market Status
We are currently in a holding pattern with multiple factors at play.
Key Trend
Gradual improvements are evident and the market continues to balance the rate of carrier population growth.
Seasonal Advice
There may be a short-lived, broad increase in post-holiday trukload spot rates.
Summary Details
Market Status
We are currently in a holding pattern as we wait to see what the New Year brings. It is likely that we will see another strike at the East Coast and Gulf Coast Ports, the impact of which cannot be precisely measured at this point. Manufacturing activity, a key component of truckload freight demand, continues to be far from ideal with no stimulus for sustained growth evident right now. Predictions of the recovery timeline for the Truckload market are varied and wide ranging. Regardless, multiple data sources continue to show that we are past the theoretical bottom of rates for truckload freight volume and rates.
Key Trend
Gradual improvements are evident in both increasing spot rates and a leveling of carrier capacity growth over the past few months. The market continues to very slowly balance the rate of carrier population growth after the extremes witnessed over the past few years. Revised trucking payroll job data may indicate the number of smaller trucking operations that will exit in January—a month known for its large number of for-hire trucking authority expirations of smaller operations.
Seasonal Advice
Due to drivers taking time off after the busy season there may be a short-lived, broad increase in post-holiday truckload spot rates for the first few weeks in January. For shippers, sufficient lead time will be key to securing the best service and pricing for truckload freight. As the Port Strikes are likely to take place, future planning for imports should be confirmed to mitigate any service disruptions. It can be concluded that costs for imported containers will increase regardless with a major ocean carrier outlining their strike-induced service cost structure already.
East and Gulf Coast Port Negotiations
January 15th is the deadline for the second phase of contract negotiations between the Longshoremen’s Union, representing the East and Gulf Coast Port Works, and the US Maritime Alliance, the organization which represents the Ports’ Management and Shipping Companies. If no agreement is reached, then a strike will occur. As of December 31st, there has been no progress made with negotiations resuming on January 7th. In October a resolution was reached regarding compensation for union workers. This current round of negotiations is focused on the amount of automation that will be put into place for port operations. The incoming administration has voiced support for the Longshoremen’s Union arguing that increasing automation will cost American workers their jobs in the long run.
Potential Impact
In theory, the application of more automated technology for cranes and gates at the ports could make it faster to unload and load container ships. However, port productivity and the contract details are beyond the scope of our focus. The biggest takeaway is that this will add more uncertainty to the overall import situation in the United States in 2025, along with the tariffs discussed last month. A strike would have a significant impact on the U.S. economy. Estimates in October ranged from $3 billion to $5 Billion per Day. Importers need to have contingency plans in place now. In anticipation of the strike, Hapag Lloyd, the fifth largest Ocean Carrier in the world, said it will impose two surcharges on January 20th, if a strike occurs. The fees apply to all inbound U.S. cargo gated-in on or after January 20 at the East Coast and Gulf Coast Ports. The charges will be $850 for a 20-footer and $1,700 for a 40-footer.
January 15
Deadline for the 2nd phase of contract negotiations.
Port Automation
and how it effects American Workers is the focus of current negotiations.
Biggest Takeaway
Combined with tariffs, the contract negotiations add more uncertainty in regards to the overall import situation in the United States.
*UPDATE*
Since the time of writing this article the Longshoremen’s Union and the US Maritime Alliance have reached a tentative 6-year deal.
Trucking Overview
There’s not an immediate and sustainable demand catalyst on the horizon to give the Trucking Market a shot in the arm. As stated, the proposed tariffs and likely port strikes will have to be monitored in real time to gauge their impact on the Trucking Economy. In theory, if some manufacturing does return to the U.S. which is part of the overall goal of the proposed tariffs it would help boost the manufacturing situation in the U.S. which has been quite bleak for some time now. That scenario could take a long time to show up in the data though.
Manufacturing Activity
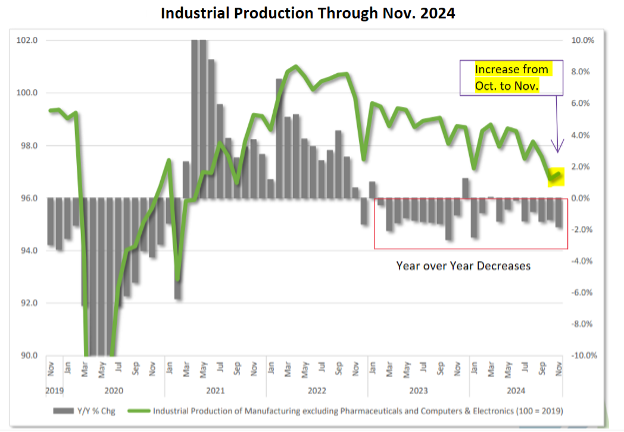
The Owner Operator and Independent Driver’s Association, (OOIDA) has concluded that Manufacturing Activity*, makes up approximately 60% of all For Hire Trucking Ton-Miles. This makes it a great indicator of future demand for Truckload Freight. In November 2024, Manufacturing Activity increased by .21% Month over Month, marking the first increase since August 2024. Manufacturing Activity is negative when compared to the same time last year for the 20th time in 23 months at slightly above negative 2%. Despite the recent increase in the Month-to-Month Metric, with this key component of For-Hire Truckload Volume depressed for some time now, you can start to get a sense of the ongoing lackluster state of the Trucking Economy.
A manufacturing recession is defined as two consecutive quarters of declining Seasonally Adjusted Manufacturing Activity. This current recession has been going on for seven consecutive quarters.
The Grey Bars in the graph to the right represent the year over year change, it is negative if below the 0% mark on the right-hand vertical Y axis. The green line represents the level of Manufacturing Activity from a Month-to-Month View.
Contract and Spot Freight Volumes
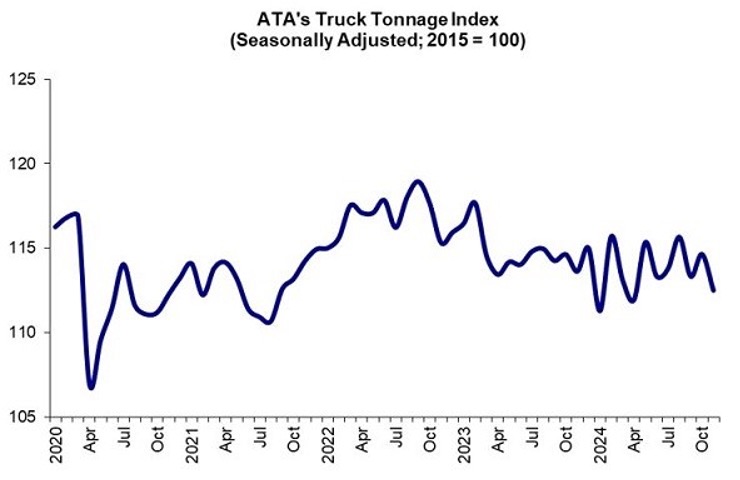
Looking at the American Trucking Association (ATA Index) to the right, you can see that we are past the most recent low point for Contract Truckload Volumes in January 2024. Contract Freight makes up most of the Truckload Freight in the United States, so seeing that the Month-to-Month changes are positive 3 out of the last 5 months is a good sign. However, with November’s index level at 112.5, down from 114.6 in October, we are still amid what the Chief Economist for the ATA, Bob Costello calls a “frustratingly choppy freight environment.”
Dry Van Spot Market View
A quick look at DAT Spot Market Van Data shows the ongoing relative flatness of Spot Rates on a large scale represented by the yellow trend line. Looking at the Mountain Charting of Spot Volumes, we can see the increased Van Volumes related to the first batch of the front loading of imports meant to avoid the first port strike which occurred this past October. You can see the drop in volumes afterwards in November. According to DAT
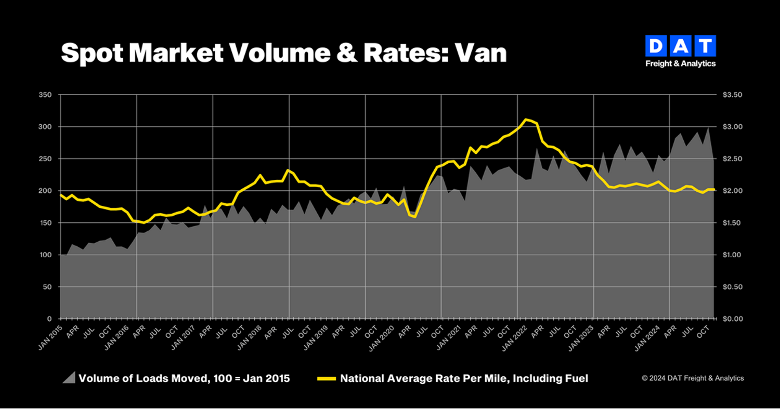
Chief of Analytics Ken Adamo, “Shippers moved so much freight into the U.S. earlier this year, ahead of potential tariffs and port strikes, that we didn’t see the volumes we might expect in November.”
*Mfg Activity
is represented by the Federal Reserve’s Industrial Production (IP) Metric with two industries removed, Pharmaceuticals and Computer and Electronics, which don’t generate that much freight relative to their share of Industrial Production overall.
A Ton-Mile
is the primary physical measure of Freight Transportation output and is defined as one ton of freight shipped one mile, it reflects both the volume shipped in tons and the distance shipped in miles.,
Combined with tariffs, the contract negotiations add more uncertainty in regards to the overall import situation in the United States.
ATA Tonnage Index
The American Trucking Association’s (ATA) For-Hire Truck Tonnage tracks the total load weight in tons hauled by trucks in the United States. It is based on the results from their surveys given to their Truckload Carrier Members, who haul primarily Contract Truckload Freight. The group has been publishing the index since 1973.
When we are dealing with numbers in the billions, an index level makes the information more digestible. For perspective, trucks hauled 11.46 billion tons of freight in 2022 which is 72.6% of tonnage carried by all modes of domestic freight transportation. The ATA says that trucking can be viewed as a “barometer of the U.S. economy”.
We can get a feel of how the U.S. economy is trending, as well as the truckload market in general, by studying this index. For simplicity we are only tracking their Seasonally Adjusted Index which accounts for seasonal impacts such as produce season. It removes the effect that a large influx of seasonal freight might have.
Fuel Recap / Outlook
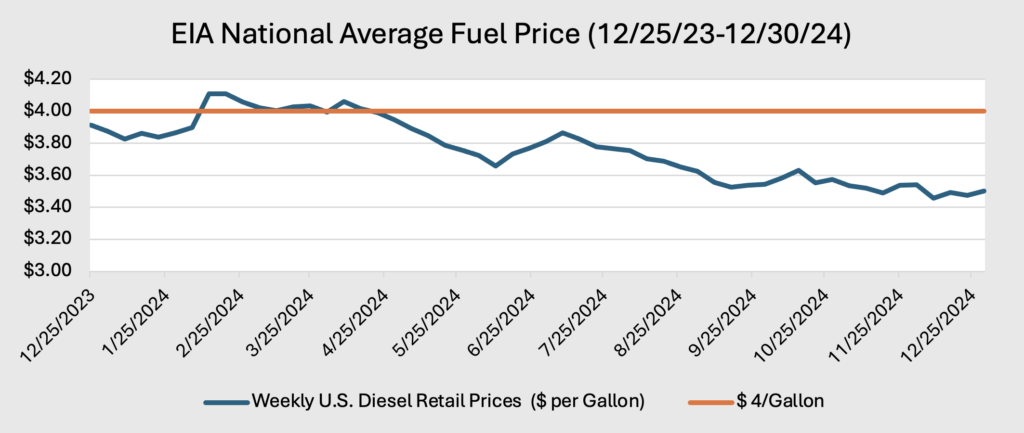
The National Average Retail Price per Gallon for Diesel Fuel has remained below $3.60 per Gallon since the middle of October 2024. In fact, in the second week of December, the benchmark price saw its largest weekly decrease of the year of 8.2 cents from $3.540 to $3.458 per Gallon. To end December, the week of 12/30 saw an increase of 2.7 cents week to week.
Fuel Trend FActors
The U.S. is producing record amounts of Crude Oil to be converted into Diesel Fuel. With an ample supply of crude oil domestically, we can avoid buying from OPEC
Globally, the market for crude oil is simply not great. OPEC has cut its production projections for a fifth month in a row.
The laws of supply and demand indicate that the National Average Diesel Price may be hovering around a theoretical equilibrium level. This is due to the uninspiring amount of freight demand overall, particularly from manufacturing.
Carrier Employment
Work Visas Update
According to a Land Line analysis of Government Data, so far for the first half of fiscal year 2025, only about 400 H-2B visas have been allocated to transportation and material-moving occupations at more than a dozen transportation industry companies. This is out of roughly 130,000 H-2B Visas for Non-Agricultural Visas. We’ll have to monitor any changes to this policy such as these visas being revoked possibly. Either way the impact of Work Visas won’t represent a huge supply side catalyst to the driver situation at this point in time.
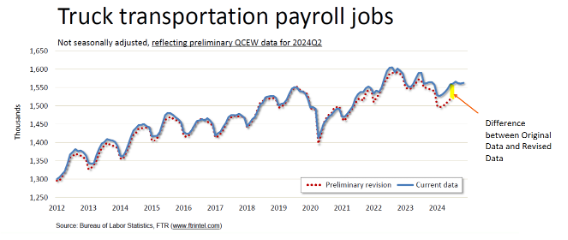
Revisions to For-Hire Trucking Jobs Payroll Employment in Trucking
The Bureau of Labor Statistics (BLS), which is the Federal Government Agency that reports on employment data recently published their Quarterly Census of Employment and Wages, a revision which accounts for new information through the 2nd Quarter of this year. The census represents more complete data than the sampling used for the BLS’ monthly data.
This revision is important because it is likely an indication of how the BLS will revise its official estimates of employment in February for their Annual Benchmark Revision for the Payroll Employment Data. Preliminary figures from the Quarterly Census show that Overall (TL And LTL) Truck Transportation Jobs in the For Hire-Tucking Sector, were about 41,000 employees below the current estimate as of the end of June 2024, revised from 1,551,000 to 1,510,000.
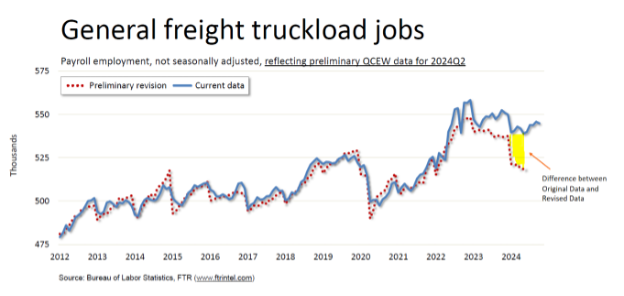
General Freight Truckload jobs are a subset of the Truck Transportations Jobs figure and were revised down by 22,000. So, a little more than half of those 41,000 jobs revised comes from General Freight Truckload Jobs, not LTL Jobs. The differences between actual and initial figures are growing “sharply” this year according to FTR, which is a Transportation Analytics Firm whose Vice President of Trucking Avery Vise who provided the breakdown of this data on his weekly podcast. In other words, Trucking Companies may have adjusted more to the level of demand in the market by removing more drivers than previously calculated by the employment data figures, and the slightly bigger chunk of that is from Truckload Driver Jobs.
However, considering the revisions, For-Hire Trucking did add jobs in November based on the most recent employment situation report from the BLS. The Alcohol and Drug Clearinghouse Final Phase from last month has not manifested itself in the employment data.
The 2900 For-Hire Trucking Jobs that were added in November was the strongest gain in a month since September 2023 when Total For-Hire Jobs rebounded by 8000 jobs following a loss of more than 31,000 LTL jobs due to the YRC shut down the month before. Aside from that large figure, November’s increase was the largest in roughly 2 years according to FTR. It will be interesting to see what the revisions are for this month, once the annual revisions are done in February.
For Hire Carrier Authority Data
While we have looked at Carrier Authority Data, which is the number of Motor Carrier Numbers or MCs in the marketplace in total before, we’ll look at FTR’s analysis methods this time because their approach counts only genuinely new capacity. For example, they do not count the number of reinstatements in their authority data because that is not 100% a new carrier.
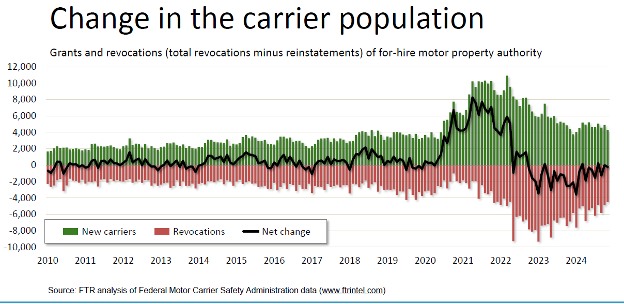
For Hire Carrier Population Trent (Active MC Numbers)
The big ups and downs in the change of Carrier Authority Data or MC Numbers, over the past 4 years may be ending based on recent trends. In November 2024, The FMCSA authorized just under new 4300 new Authorities, and the number of Revocations of Authorities Net of Reinstatements were more than 4500. This resulted in a Net Decrease of 231 Carrier Authorities. In October 2024 there was a net increase of just 12 Authorities.
Looking at the average change per month in authorities leaving this year compared to last year, the number of authorities exiting has slowed. Over the past 4 months, the monthly average decline has been 327 Authorities. Last year, there was an average of 1755 authorities exiting each month. So that is roughly 81% less Authorities exiting each month on average for the past 4 months compared to the monthly average for all of 2023.
Despite the trend adjustment, as of November the number of active for hire trucking firms are still close 36% than compared to start of pandemic according to FTR.
Conclusion for Supply
Once the December and January For-Hire Carrier Authority Data is available, we can gauge how significant of an exit there is of carriers who may have waited until the end of the year to not renew their authority.
We can’t make too many assumptions, but it could be likely that like the revised individual job data, when we get the December and January Authorities Data it may bring to light many trucking operations that are currently on the sidelines, but their informal exit has not shown up in the Authority Information yet.
Historically, January has been a month with high levels of carrier exits, and while they are not the most exciting metrics, we have to look at both of these measures because the Individual Jobs counted represents the companies that are large enough to have actual payroll compared to the Carrier Authorities Data which represent most likely the one and two truck operations that enter and exit the market regularly.
The decrease in the number of monthly exits for authorities implies that the trend of a frenzy of new small entrants chasing high rates like in 2020 through 2022 is over. Abstractly, I believe that there is some rationality coming back into the dynamics of the Truckload Market. You can see this also with Spot Rates very slowly increasing, possibly reacting to the levelling of the number of carriers.
Rates
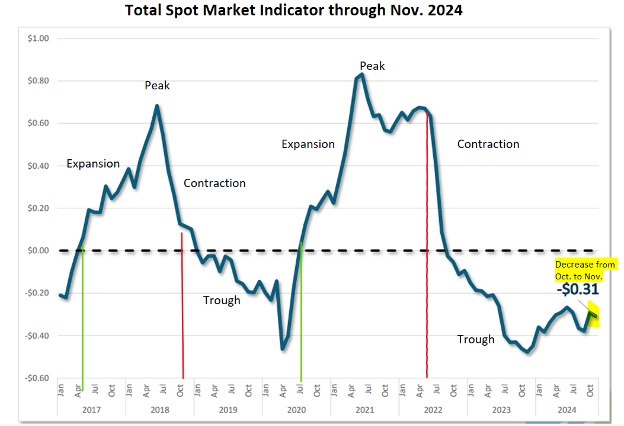
The OOIDA’s November 2024 update to their Total Spot Market Indicator, an index which tracks the difference between the Total Spot Rate from for all 3 Major Equipment Types, plus specialized freight, and the 3-Year Total Spot Rate Moving Average from their data shows that from October to November, the reading decreased from -.29/Mile -.31/Mile. In other words, we’re looking at how a composite spot rate representing all modes in the Truckload Market is trending compared to the last three years on average. So, seeing that the most recent data has decreased by a little over 5% Month-to-Month is a little bit of a letdown after having an increase in October of 23% Month-to-Month, after 3 months of decreases before that. However, the group remains confident that a market shift will occur sometime early during the Second Quarter of 2025, with the index showing a 35.5% increase when compared to November of 2023. The index made up of Spot Rate Data made available to the group, by FTR and Truckstop shows that overall Spot Rates have been slowly increasing relative to their most recent bottoming out point in November 2023. Movement in the Spot Rate Reading towards zero in either a positive or negative direction implies that the market is shifting.
The TMSCI has accounted for at least the 2 previous entries into what the authors refer to as a market upcycle or Bull Market. These approximate checkpoints (Green Lines) occurred in May 2017 and July 2020 respectively,
It also has accounted for the previous 2 downcycles or Bear Markets (Red Lines) in October 2018 and June 2022.
The most recent peak was in May of this year and overall, you can see by the trend line that it is incrementally getting better, we have not gone back down to the most recent low point observed in September 2024.
Looking at the 2020 to 2021 portion of the chart you can see the extreme movement in Spot Rates. In my opinion, we won’t see these types of increases in the next year. It will be a gradual increase towards the next upcycle. Overall, this is promising since Spot Rates are a leading indicator of Contract Rates, we can take this as an indication that rates overall are trending upwards.
2024 Year-End Conclusion
Measuring the stages of a marketing cycle can be very abstract, particularly for Truckload where there are no central or standardized pricing measures. The pandemic shut businesses down and exposed vulnerabilities in our supply chain network overall causing major disruption in normal operations. With that disruption, there were new entrants to the truckload market who capitalized on the situation faced by shippers and reaped the benefits in the form of high truckload spot rates. However, that bull run or boom time didn’t last. As noted in previous updates, those carriers who can make a profit remain and those who cannot exit the market. We have reached a time now in which the market is very slowly rebalancing after a period of extremes. Operators that are here have been able to weather the downturn and will continue to operate into the future.
Due to the abstract nature of market equilibrium and recovery, opinions on the matter are varied and numerous. Some experts such as OOIDA are predicting a recovery in Q2 this year. Others, such as seasoned trucking economist Noel Perry, don’t see this happening until 2026. Regardless, it is imperative to build quality into your operations no matter the type of organization you work for. The days of carriers consistently receiving extremely high spot rates, that are beyond a shipper’s control, are over. This will only become more evident as we progress into the new year. There will always be pockets of disruption in which carriers will be able to command higher than market rates. However, based on the very slowly increasing spot rate data available to us right now, it can be concluded that carriers are acting in their best interest and are starting to demand higher spot rates overall. As catalysts emerge in the new year, we will be able to get a better idea of the scale and duration of price increases.
Research and Analysis by David Decovnick
Port Strikes, Import Volumes, and Tariffs
https://www.ttnews.com/articles/us-dockworkers-halt-strike
https://www.ttnews.com/articles/dockworker-talks-resume
https://www.ttnews.com/articles/trump-supports-dockworkers
https://www.logisticsmgmt.com/article/u.s_bound_imports_see_further_gains_reports_sp_global_market_intelligence
https://www.logisticsmgmt.com/article/november_pola_and_polb_volumes_post_another_strong_month_of_gains
https://www.ttnews.com/articles/ports-los-angeles-long-beach
https://www.ajot.com/news/trump-tariff-threat-helps-lift-us-ocean-imports
https://www.supplychainbrain.com/articles/40861-busiest-us-container-ports-set-to-close-2024-with-record-volumes
https://www.supplychain247.com/article/six-steps-prepare-2025-tariffs-avoid-disruption
How will trucking fare against tariffs? Economists weigh in | Trucking Dive
https://www.maritime-executive.com/article/hapag-lloyd-sets-work-disruption-surcharge-for-us-east-gulf-coast-ports
Work Visas
ATA Tonnage
https://www.trucking.org/news-insights/ata-truck-tonnage-index-contracted-19-november
DAT Data
OOIDA Study – Rates and Industrial Production
https://www.ooida.com/wp-content/uploads/2024/12/06-Monthly-Market-Update-2024-12.pdf
https://www.ooida.com/wp-content/uploads/2024/11/06-Monthly-Market-Update-2024-11.pdf
FTR Podcast / FTR Podcast Slides - Week of Dec. 9th
https://www.ftrintel.com/trucking-podcast?__hstc=247732432.5e65cce899f5d6f7109b1fd89e47dc2a.1702397218750.1708538781426.1708544416633.64&__hssc=247732432.1.1708544416633&__hsfp=1257128040 https://content.ftrintel.com/hubfs/State%20of%20Freight/Podcast%20Downloads/Trucking%20Podcast/12.9.2024%20-%20Episode%20293/FTR%20Trucking%20Market%20Update%20Podcast%20-%20Episode%20293.pdf
Various Data
https://www.ttnews.com/articles/freight-market-trough-2024
https://www.fleetowner.com/news/article/55135785/freight-market-recession-recovery-equilibrium-not-for-another-two-years-say-truckstop-and-transport-futures-analysts
Diesel Fuel
Ton Mile Index
https://www.bts.gov/archive/publications/transportation_statistics_annual_report/2003/chapter_02/domestic_freight_ton-miles#:~:text=Thus%2C%20on%20a%20ton%2Dmiles,of%20activity%20in%20the%20economy
