
February 2025
Our signal color this month is moving to red. We’re roughly 25% through the first quarter now. With how tumultuous this month has been it is a good time as a shipper, and just in general, to stop and see what was issues and strengths were brought to light
Market Status
January showed vulnerabilities to short-term disruptions and we still have yet to see a catalyst emerge for sustained recovery.
Key Trends
Spot and Contract volumes remain close to amounts seen in ’23 and ’24. The East/Gulf Coast port strike is resolved but tariffs loom.
Seasonal Advice
As we enter the (traditionally) slow season for freight overall, it would be wise to use this time to plan for next quarter.
Summary Details
Market Status
January showed that Truckload pricing and carrier availability are particularly vulnerable to short-term disruptions caused by extreme weather. For the month of January, the year over year change in prices paid to carriers was the highest seen since June 2024 during the midst of last year’s Produce Season. Despite the recent activity, any supply or demand side catalysts that will provide a sustained recovery remain to be seen right now. In the long run, it will need to be some combination of both supply and demand changes happening together for a meaningful recovery to occur.
Key Trend
Both Spot Volumes and Contract Volumes remain close to the amounts seen in 2023 and 2024. It is a positive that volumes have not decreased at all, even though it is not the most exciting metric to consider. The change in the number of jobs held at larger Trucking Companies month to month, seems more stable than the amount of smaller carriers entering and exiting each month. The East Coast and Gulf Coast Port Strike is resolved for now but Tariffs loom. The timing of and possible effects on Trucking are not 100% certain and will have to be dealt with in real time.
Seasonal Advice
We’re entering what is considered the traditionally slow season for freight overall. Use this time to plan for the next quarter. Planning should include the impact of Produce Season, even if you don’t ship produce. With the overall gradual upward pressure on rates likely to continue, this upcoming quarter may be a time of significant activity. There are many regulatory factors discussed in 2024 that have not been resolved going into the second month of the new year. With the new Dept. Of Transportation (DOT) Secretary confirmed, he will now be able to review any proposed legislation regarding Trucking.
Port Strike Resolved
As mentioned in last month’s edition, the Gulf and East Coast port strikes have been avoided for now. The International Longshoremen’s Association (ILA) and the U.S. Maritime Alliance (USMX) have reached a tentative 6-year Master Contract Agreement regarding all issues. Details on the scale of automation technology that will be used have not been disclosed yet. Both parties will still need to ratify the contract but no dates for the ratification votes have been scheduled yet. However, the ports will remain open for now. Unless a previously unreported factor emerges that hinders the ratification, we can check the port strike off the list of things to worry about for now.
Agreement Reached
A tentative 6-year Master Contract Agreement has been settled on but still needs to be ratified.
Current Tariff Situation
As of Monday, January 20th, Federal Agencies have until April 1st of this year to analyze U.S. Trade Policy and recommend changes based on their research per the New Trump Administration. Despite this deadline, the Administration is calling for tariffs of 25% for Canada and Mexico to be put into place on February 1st, as well as an additional 10% tariff for China. This could have a more significant effects on trucks crossing in to the United States from Mexico than Canada given recent trends.
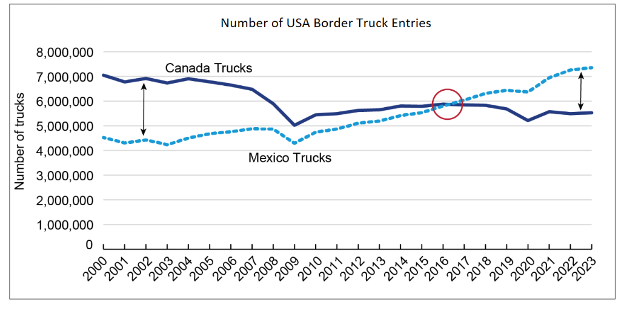
For perspective, the number of trucks entering the United States from Mexico is now greater than the number of trucks entering from Canada, according to the U.S. Bureau of Transportation Statistics. Shippers have done their best to avoid these tariffs at the ports, reflected in the impressive U.S. Import Levels according to S&P Global Market Intelligence. Total Imports for the Calendar Year 2024 increased 11.6% from 2023 to 32.2 TEU (Twenty Foot Equivalent Units).
This situation is not something that organizations can prepare for in entirety. Companies will need to develop scenarios and monitor the impacts of tariff in real time and adjust their operations and pricing accordingly.
*UPDATE*
Since the time of writing President Trump and President Sheinbaum have reached an agreement that postpones the implementations of tariffs on both sides, for one month, while negotiations take place.
Canada has placed tariffs on over 1,200 products totaling at around 17% of all products imported from the United States to take effect on February 4. Items under the tariffs include wine, beer, motorcycles, cosmetics and more.
New DOT Secretary
With a 77-22 Congressional Vote in favor of Wisconsin Congressman Sean Duffy, he is now confirmed as the Secretary of the Department of Transportation as of January 28th. Duffy is viewed as an ally for the Trucking Industry by groups such as the ATA. He told the Senate Committee reviewing him that “If confirmed, we will craft clear regulations that balance safety, innovation and cutting-edge technology.”
Mr. Duffy will have his hands full regarding trucking litigation. There are numerous issues floating around at this point including Broker Transparency, which entails a carrier’s rights to view transaction data, Speed Limiters, Autonomous Vehicles and revising Federal Motor Carrier Safety Association (FMCSA) Safety Classifications to name a few. Like other incoming Presidential Administrations, The Trump Administration has ordered a regulatory freeze during which no new regulations can be put into place at any Federal Agency, including the FMCSA.
Ultimately, no one can confirm what the effects of any Tariffs will be with 100% certainty, especially for U.S. Truckload Market dynamics. Speculation is rampant over things that may have an impact, from calls for Tariffs to increase inflation domestically to other countries reacting with Retaliatory Tariffs (which would increase our cost to export to them). The timing of any Tariff effects remains debatable, however the time in which to beat these policy moves by frontloading inbound containers to the United States is over. More than likely, the New DOT will have a regulatory stance that favors Truck Drivers, especially Independent Owner Operators. No deadlines for any Trucking Regulations have been planned, we’ll monitor them as they come up.
ATA Index
Seasonally adjusted, the amount of For-Hire Tonnage hauled in the United States decreased month to month from November to December by 1.1%. Also seasonally adjusted, the index reading is now equal to 111.3. This is the lowest reading since January 2024 when the index reading equaled 111.0. ATA Chief Economist Bob Costello commented on the results ” Sluggishness in factory output continues to weigh on freight volumes, but another drag on the index has been fleet growth at private carriers, which is holding back how much freight is flowing to for-hire carriers.”
The ATA projects in their Annual Freight Forecast that overall truck volumes will grow by 1.6% in 2025 and increase to close to 14 billion tons by 2035. This prediction is optimistic after two years of annual decreases in the index readings. The forecast states that “Total truck tonnage will rise from an estimated 11.27 billion tons in 2024 to 13.99 billion tons in 2035. Over that same period, trucking industry revenues will grow from an estimated $906 billion to $1.46 trillion, accounting for 76.8% of the freight market by the end of the forecast period.”
In the For-Hire TL market, we are back to roughly the same amount of freight tonnage being hauled in the country that we saw at the end of January of last year. In my opinion, I am grateful that the reading is only the lowest since January 2024. I think that it shows that we are stabilizing. Private Fleets gained popularity after shippers experienced disruptions during the last few years due to the pandemic induced trends and are cited by the ATA’s Chief Economist as part of the reason for the choppy recovery trends. The shape of the 2024 ATA Tonnage Trend Line shows
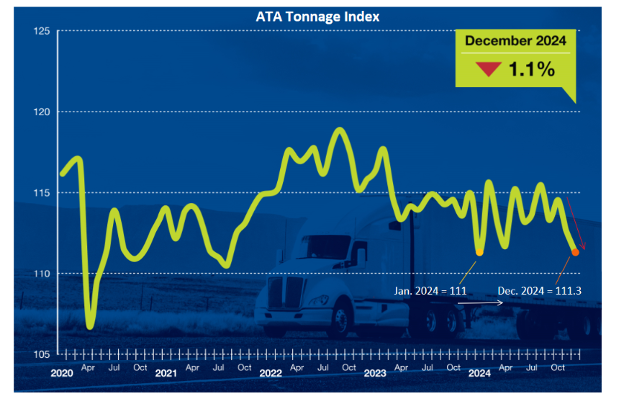
volatility or choppiness in the month-to-month readings. There is a similar choppiness in the OOIDA’s analysis of Industrial Production examined in last month’s update. Manufacturing drives freight volumes and this data coincides with Costello’s analysis of “sluggishness in factory output” resulting in decreasing volumes month to month. To recap, a Manufacturing Recession is defined as two consecutive quarters of declining Seasonally Adjusted Manufacturing Activity. This current recession has been going on for seven consecutive quarters according to the Industrial Production data issued by the Federal Reserve.
FTR Analysis Truckstop
According to FTR’s Analysis of Truckstop’s Load Posting data, for the week of 1/13/24, total load posting activity declined 4.2% after surging more than 77% in the previous week. (Shown by the Blue Bar Graphs). The Volume was more than 8% higher than during the same week of 2024 but almost 24% below the five-year average for the week (2024 Data = Orange Line, 5 Year Average = Dotted Line). The week of 1/20 shown by the third bar shows load activity down 15.4% from the week of 1/13, but this is likely due to the Federal Holiday, Martin Luther King Day on 1/20.
The amount of spot loads for the week of 1/13 are trending slightly higher than last year for the same week but lower than the same week in 2023. The 5 Year Average dotted line shows the extreme
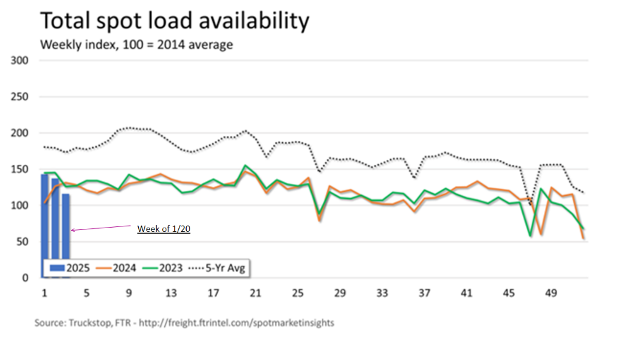
levels of the past few years of the number of loads that were put out to the Spot Market. The fact that the first two weeks of the year are following similar trends to the last two years shows the steadiness in the amount of spot freight being distributed to carriers by shippers despite any disruption caused by the winter weather.
Fuel
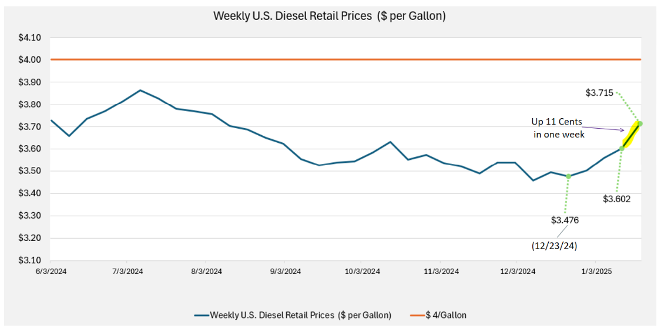
The National Average Price per Gallon for Diesel Fuel increased by 11.3 cents for the week of 1/20/25 from $3.602 to $3.715. This is the largest weekly increase since August 2023. We are only a few weeks in the First Quarter of 2025, and prices as shown in the trend line have been increasing up until 1/20, since the recent low point on December 23rd, 2024. The Energy Information Administration’s “Short Term Energy Outlook” published in January 2025, predicts that the National Average Price for Diesel will equal $57/Gallon in the first quarter of 2025. EIA predicted in their analysis that the price will increase each quarter with the National Average equaling $3.76 by the end of this year. After a huge increase of 11 cents during the week of 1/20, the last week of the month saw this gain cut in half roughly by dropping 5.6 cents. Colder weather means that Diesel Fuel burns faster and that drivers will have to use more of it.
Carrier Jobs and Authorities
In December, the number of Payroll Trucking jobs decreased by 800 after Seasonal Adjustments according to the Bureau of Labor Statistics (BLS) Preliminary Estimate to equal 1,545,900 jobs. Compare this to the previous two months where revisions to the losses show 1600 jobs lost from September to October then 1700 Jobs added from October to November.
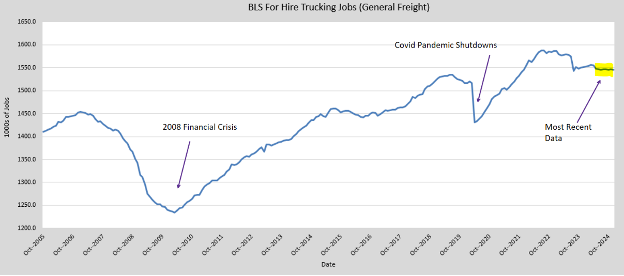
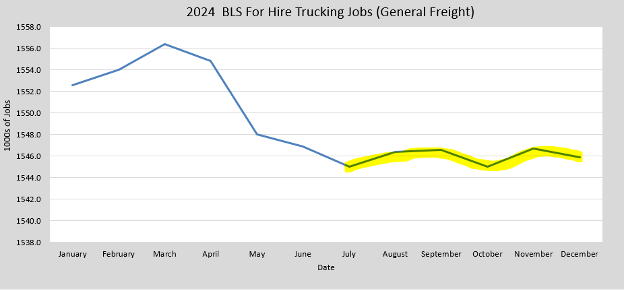
For perspective, I’ve included the BLS data going back to 2008, where you can see that, like in 2020, the number of jobs decreased due to bad economic conditions. Although the drop in 2020 was more severe because of the pandemic and the sudden shutdown of businesses. You can see the relative flatness in number of jobs from July 2024 in the second graph. (Revised Data will be available next month for all of 2024)
For Hire Carrier Authorities
In December, 7229 Carrier Authorities exited while 5221 carrier authorities were added, resulting in a net change of Negative 2108 authorities. We are looking at Authority Grants and Reinstatements together this time as Total Additions. This is the largest monthly decrease in Authorities since September 2024 when the net change was 1413. December does have 5 Mondays though so the data should be taken with a grain of salt. The FMCSA does the bulk of revocations on Mondays, so the sample size is larger in the most recent month according to Avery Vise, Vice President at FTR, a Freight Analytics Company.
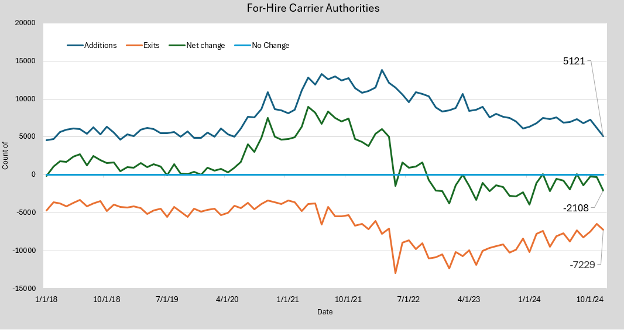
Looking at this data long term, I concluded that the average net change in carriers from 2018 to 2019 was roughly 1150 carriers added per month. From 2020 until Dec. 2024, in total the average change per month was 1571 carriers per month. For 2024 only, the total average monthly change in the carrier authorities was a negative 1189 per month.
Larger Carriers Jobs have remained relatively stable recently while the number of smaller trucking operations represented by authorities is decreasing overall. It’s becoming harder for smaller carriers to manage costs while the larger operations may benefit from aspects such as volume discounts for fuel. While the increase in Diesel Fuel is probably going to be short lived if Diesel Prices remain elevated it will be interesting to see the trends moving forward in the Carrier Authority Data. These carriers exits are just one component to the recovery that we are hoping for. In theory, the less of a carrier supply there is, the more it would increase prices. However, Demand will have to recover as well for a catalyst to increase prices and drive recovery in the long run.
Clearinghouse Update
To follow up on the November Implementation of the Drug and Alcohol Clearing House, it really has not been a catalyst that has reduced driver numbers significantly as of this point. In fact, the number of drivers who are in Non-Prohibited Status has increased from 91,950 in October to 99,090. While the number of prohibited status drivers and total number of drivers in the clearinghouse has not changed significantly. Perhaps the looming deadline was a motivator for drivers to complete their return to duty. If nothing else these updated standards are another factor that will keep capacity in check moving forward, helping to reduce the impact of the current overcapacity of carriers.
Rates
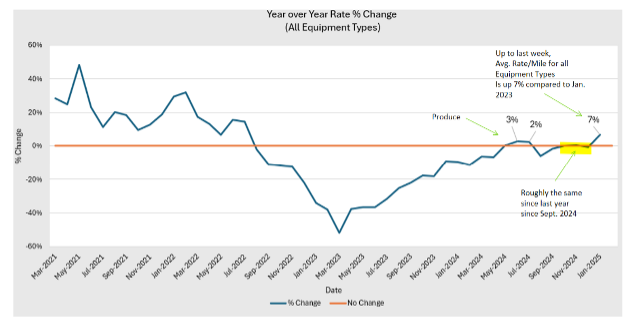
Monitoring the relationship between Spot Rates and Contract Rates is key to gauging how fast the market is gaining momentum. Spot Rates are a leading indicator of the Contract rates which are fixed rates agreed to buy shippers to pay carriers. Concept has a mix of Contract and Spot Rates distributed among various equipment types with most of our freight being hauled on Dry Vans.
This is the first month since Produce Season 2024, that we saw increases in our average rate per mile for all equipment types. Our rate per mile paid was up 7% through the second full week of January, compared to January 2024. This shows how a short-term market disruption such as the Polar Vortex Storms can have on a market that seems otherwise balanced.
We will monitor subsequent changes but keeping an eye on this metric will allow us to monitor when we are entering the next Truckload Market Cycle.
Research and Analysis by David Decovnick
Imports, Tariffs, Port Strike
https://www.truckingdive.com/news/trump-tariffs-trade-policy-executive-order-inauguration/737827/
Cross-border freight dominated by Mexican truck cargo – Land Line
Trump eyes 10% China tariff hike by Feb. 1 | Supply Chain Dive
Trump Says 25% Tariffs on Canada and Mexico Coming Feb. 1 | Transport Topics
Trump orders trade review ahead of potential tariffs | Trucking Dive
Tariffs and Their Ripple Effects: Key Insights for Strategic Planning
https://www.truckingdive.com/news/inflation-challenges-2025-fed-rate-cuts-tariffs/737211/
US Senate Committee advances Trump nominee to head Transportation Department | AJOT.COM
https://www.ttnews.com/articles/duffy-promises-bold-vision?ref=freightcaviar.com
https://landline.media/broker-transparency-proposal-seeks-fairness-for-truckers/
‘Electric vehicle mandate’ going away? Trump’s EO explained – Land Line
Trump issues regulatory freeze in return to office | Commercial Carrier Journal
https://www.reuters.com/world/americas/canada-take-legal-action-against-us-tariffs-2025-02-02/


